



Creando un MCP para OpenObserve
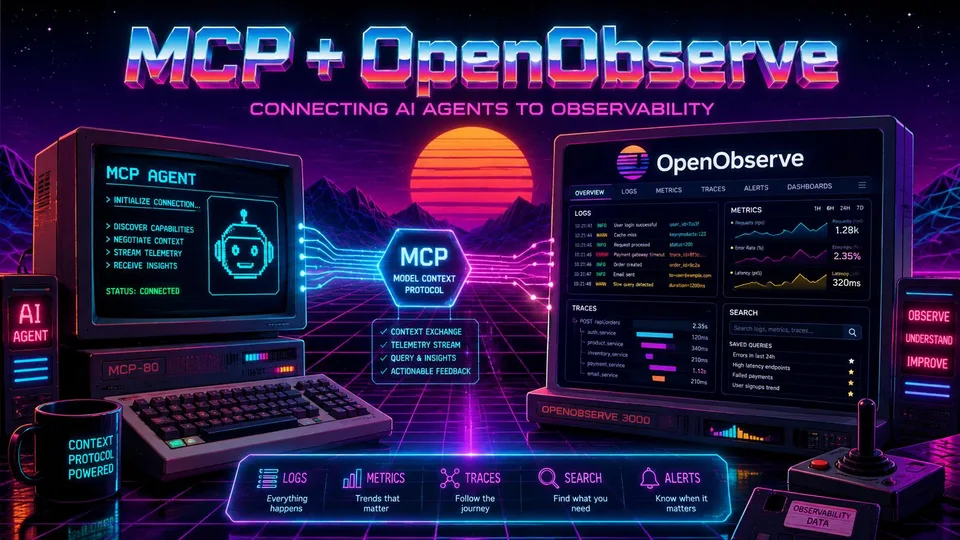
How I connected my AI assistant to my production logs: Creating an MCP for OpenObserve.
Imagine this scene: you are in the middle of an intense debugging session with your AI Assistant (whether Claude, Gemini, or GPT). The code looks correct, but the application keeps failing in production. You explain the error to the model and it says: "Could you show me the latest logs from the payment service so I can understand what's happening?".
At that moment, your workflow breaks:
- You leave your IDE or terminal.
- You open a browser and go to the OpenObserve web console.
- You write an SQL query or search for time and error‑level filters.
- You copy a gigantic wall of log text.
- You return to the AI chat and paste it (praying you didn’t accidentally copy an API key or a sensitive session token in plain text).
This process is slow, interrupts your concentration, and opens possible security gaps.
To solve this problem, I decided to build a read‑only Model Context Protocol (MCP) server that acts as an intelligent gateway between AI assistants and our centralized Log Gateway API.
In this article I’ll tell you how I did it, the problems it solves, and why I think MCP servers are the missing piece in the AI‑assisted development revolution.
🛠️ What is MCP (Model Context Protocol) and why does it change the game?
The Model Context Protocol (MCP) is an open standard developed to allow language models (LLMs) to interact safely and structurally with local or remote tools and data.
Instead of building ad‑hoc integrations for each tool, MCP provides a common protocol (based on JSON‑RPC 2.0 over stdio or HTTP) so that the AI assistant can discover and execute "tools" that you expose from your system.
In my case, rather than giving the AI direct access to our entire OpenObserve infrastructure (which would be a huge security risk), I created a MCP server in Node.js that serves as a secure, read‑only bridge.
💡 The Solution: MCP Log Gateway for OpenObserve
The project consists of an MCP server that consumes the corporate Log Gateway API. The AI does not know what OpenObserve is, nor does it have master credentials. It only knows a set of query tools that the MCP server exposes.
When the AI needs data, it invokes an MCP tool; the server validates the request with strict Zod schemas, performs the authenticated HTTP query against the gateway, and returns clean, formatted results to the AI.
AI Assistant (Claude, Gemini, GPT...)
        │  (MCP tool call)
        ▼
┌─────────────────────────────────┐
│       mcp-openobserve           │  ← My MCP server (stdio)
│   • Validates inputs with Zod   │
│   • Redacts sensitive data      │
│   • Handles pagination          │
└──────────────┬──────────────────┘
               │  (Authenticated REST request)
               ▼
┌─────────────────────────────────┐
│       Log Gateway API           │  ← Centralized gateway
└──────────────┬──────────────────┘
               │
               ▼
   [ OpenObserve / Streams ]
🚀 Key Features and Design Decisions
Designing this system to be used autonomously by an AI forced me to make very specific architectural choices:
1. Security by Design (Read‑Only and Secret Redaction)
The server is strictly read‑only. There are no tools for writing, modifying, or deleting logs. Moreover, internal logs and the responses sent back to the assistant pass through an automatic redaction filter. If an error message or header contains an API key, password, cookie, or Bearer token, the server detects it and replaces it with [REDACTED] before it leaves the machine.
2. Trace Correlation with Controlled Fan‑Out
One of the biggest headaches in micro‑service architectures is following a request’s trail. If the AI receives a request_id or trace_id, it can call the tool get_log_by_trace_or_request without specifying a service. The MCP server will concurrently query (with a bounded pool of 3‑5 simultaneous requests to avoid saturating the gateway) all authorized services, merging the results into a single chronological trace. The AI can see the full flow of the request across the entire infrastructure in seconds!
3. Smart Summaries and Auto‑Pagination
If there are thousands of error logs, we don’t want the AI to fill the chat context reading them one by one. The summarize_errors tool gathers logs from the selected time window, normalizes the messages (collapsing spaces and cleaning noise), and groups them by frequency. The AI receives a report like: "Error X occurred 150 times, and error Y occurred 12 times", allowing you to prioritize analysis.
4. Ergonomics: "Local Logs First"
To optimise resource usage and cost, the assistant is trained to follow a simple rule: if you are debugging a recent local development error, it will first look at local log files (.logs/app.log). It only escalates to the MCP if the context is remote (production/staging), a historical query, or a specific gateway identifier is requested.
📦 The Technology Stack
To ensure an ultra‑fast startup (under 5 seconds) and minimal resource consumption, I chose modern, lightweight technologies:
- Node.js (v24.4.1) and TypeScript (v6.0.3) with native ES Modules (ESM) support.
- Zod (v4.4.3) for strict validation of all tool input parameters before making network calls.
- Pino (v10.3.1) for super‑fast structured logging, redirected to
stderrso as not to pollute thestdoutchannel (reserved for MCP JSON‑RPC messages). - Vitest (v4.1.8) for testing. We achieved over 80 % code coverage on lines, functions, and branches, including unit, contract (gateway mocks), and integration tests.
💭 Personal Reflection
Building this MCP was not only a fun technical challenge to understand the new AI‑assisted development standards, it completely transformed my workflow.
Debugging no longer feels like "going fetch data to give to the AI". It now feels like a fluid collaboration: I identify the high‑level problem and my AI assistant gathers the operational context, aggregates errors, and suggests the exact line of code that is failing.
Protocols like MCP demonstrate that the future of programming is not the AI writing all the code for us, but us designing secure tools and boundaries so the AI can act as a truly autonomous and efficient co‑pilot.