

SmartDisk Monitor: escuchar al disco antes del susto
SmartDisk Monitor: Listening to the Disk Before the Scare
Imagine the computer starts behaving oddly. A copy takes longer than expected, a disk disappears for a moment and Windows shows a message that seems written for another Windows. Before swapping parts blindly, it would be useful to know what is happening.
For that I have developed SmartDisk Monitor: a Windows application that gathers disk health, temperature, wear, activity and history, and correlates them with system events. It is available, free and its code is open.
I haven't built a crystal ball. I have built a way to look at disks with a bit more criteria than "it worked yesterday".
Knowing Which Disk Needs Attention
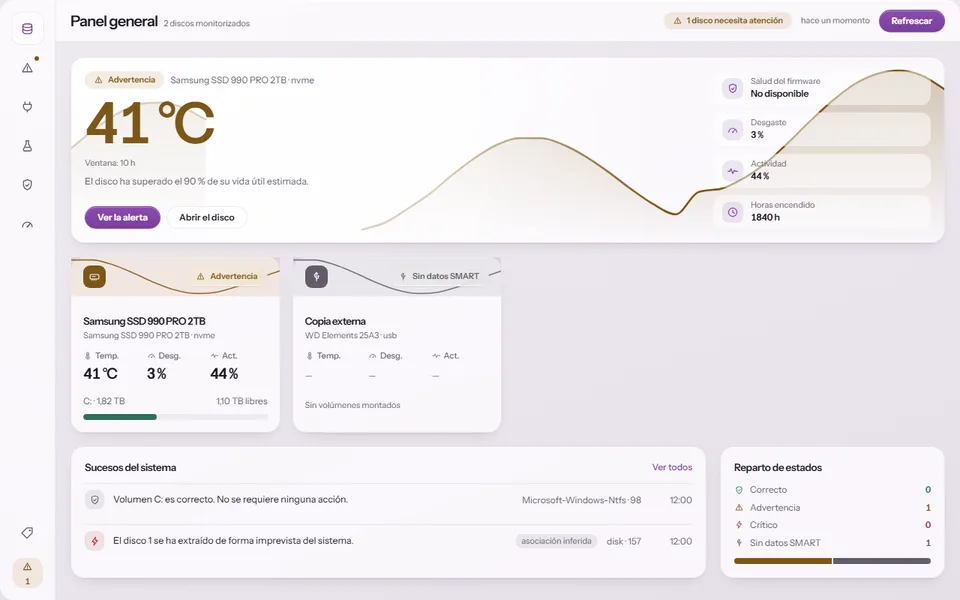
The panel detects physical disks, partitions and volumes, and lets you choose which ones you want to monitor. Each disk has its own card, with its main data and a recognizable status. You can see available capacity, activity and recent events without opening a dozen tools.
Below is a distinction that seems fundamental to me: not having a data point does not mean there is a failure. Some USB devices, RAID controllers or virtual environments do not expose SMART information. In that case, the app indicates a neutral status. Painting it red would be very eye‑catching. It would also be misleading.
A Loose Temperature Tells Half the Story
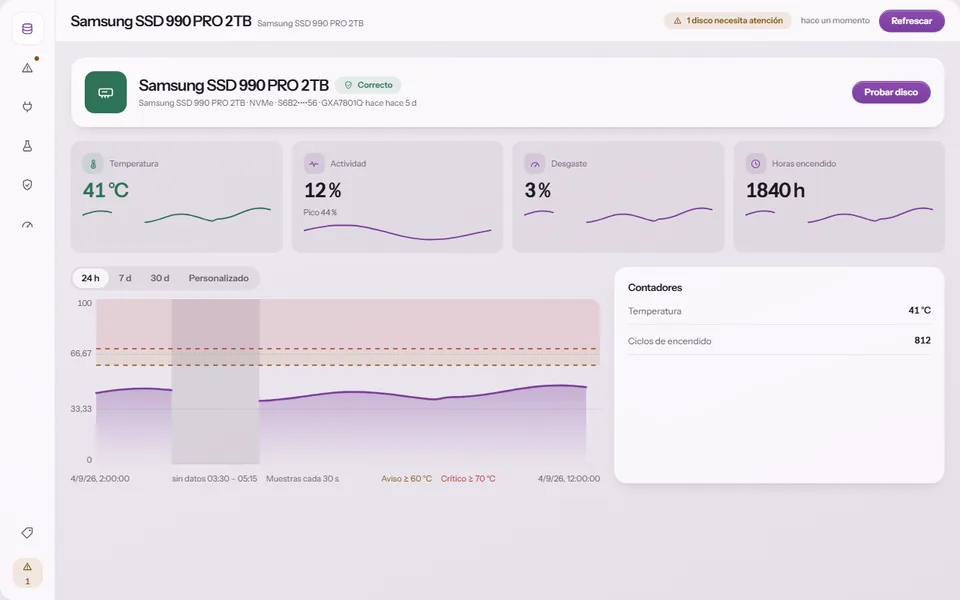
SMART and NVMe provide data from the device itself: temperature, wear, errors, power‑on hours and other counters, depending on what each disk supports. SmartDisk combines those readings with Windows performance counters to show activity, speed and latency.
The card for each disk adds time to the equation. You can view graphs and history and see warning and critical zones over the graph itself. That way you don't have to memorize a threshold to interpret a curve.
To me, a diagnostic screen should help you understand a situation. Showing you twenty numbers and leaving you alone with them is delegating the work to you with a pretty font.
Alerting Without Becoming the Drill‑Neighbour
An alert that repeats on every measurement ends up achieving the opposite of what it intends: you stop paying attention to it.
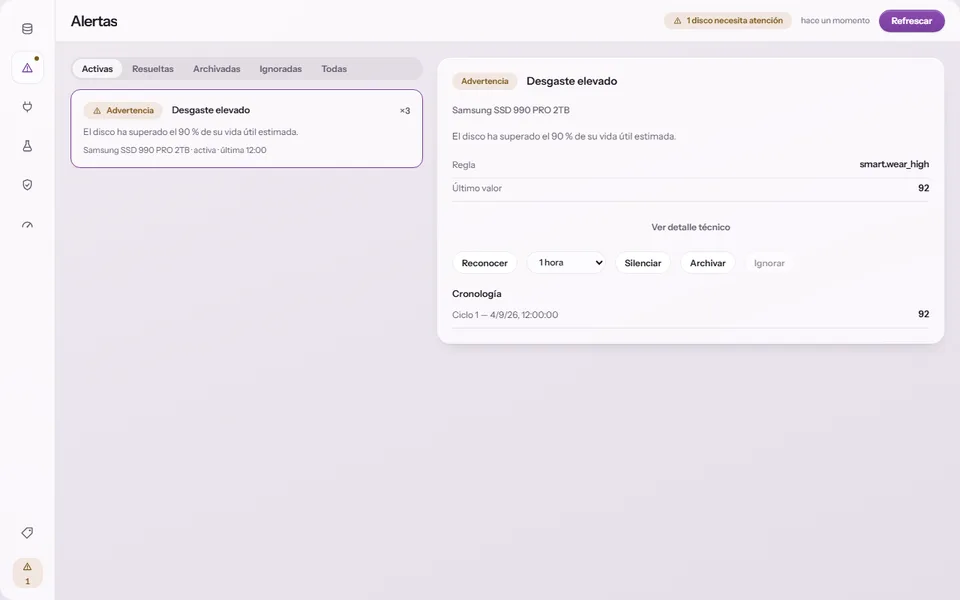
I have incorporated alerts grouped by condition, with chronology and actions to acknowledge, silence or archive them. The logic uses hysteresis to avoid a reading that oscillates around the threshold generating continuous alerts. The status reflects the worst unresolved alert, and you can also follow it from the system‑tray icon.
The goal is for the alert to retain its meaning. If everything seems urgent, nothing does.
Windows Also Tells Things; We Need to Gather Them
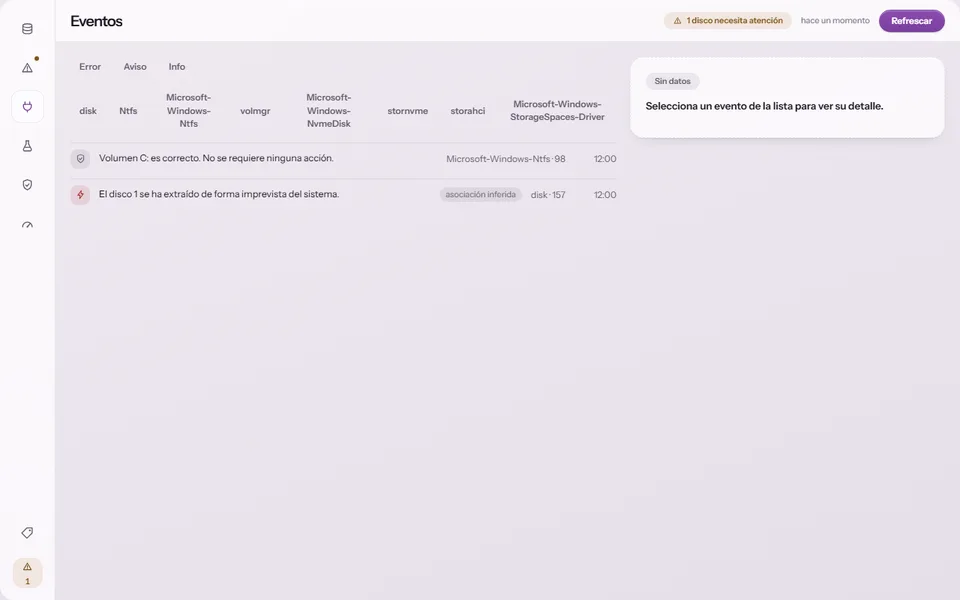
Disks do not live in isolation. Windows logs errors, disconnections and other storage‑related events. SmartDisk collects the relevant events and associates them with the corresponding disk when possible.
And when it cannot be sure, it says so: the association can be exact, inferred or unknown. The technical detail and the original XML remain available.
It looks like a small decision, but it is important: I prefer to show uncertainty rather than disguise it as certainty. Having metrics and incidents together gives context for investigation without hopping between windows.
Tests When You Ask for Them
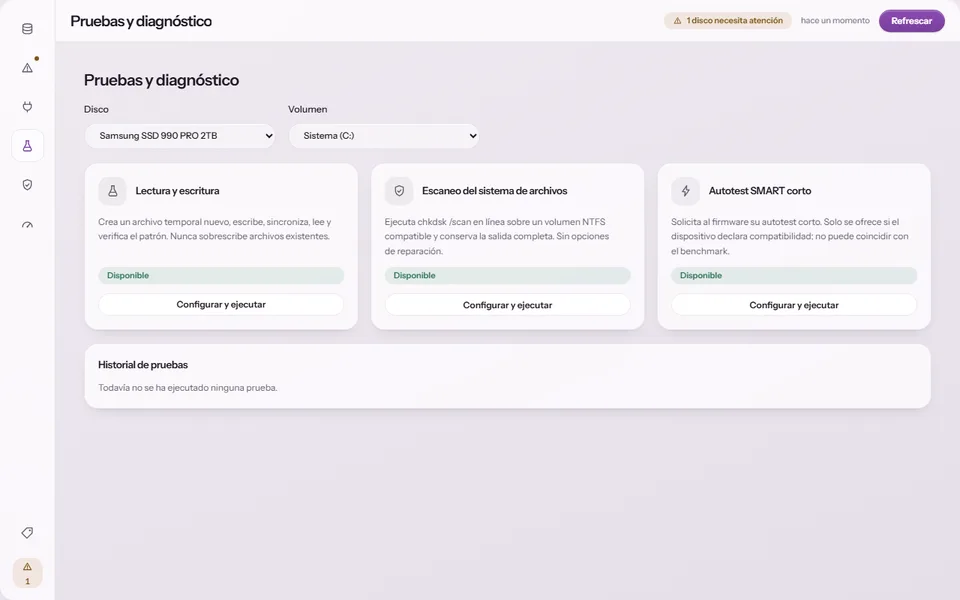
You can also run on‑demand tests: read and write, a file‑system scan with chkdsk /scan and a short SMART autotest if the device supports it.
The app shows progress and includes limits to stop a test if temperature rises too much or space runs low. The read/write test works with a new temporary file; it does not need to overwrite your files.
These are not "fix everything" buttons. They are tools to observe and verify, with clear execution conditions. When you are investigating a disk that worries you, adding another problem to the experiment is not very helpful.
Sharing the Diagnosis Without Giving Away Your Identifiers
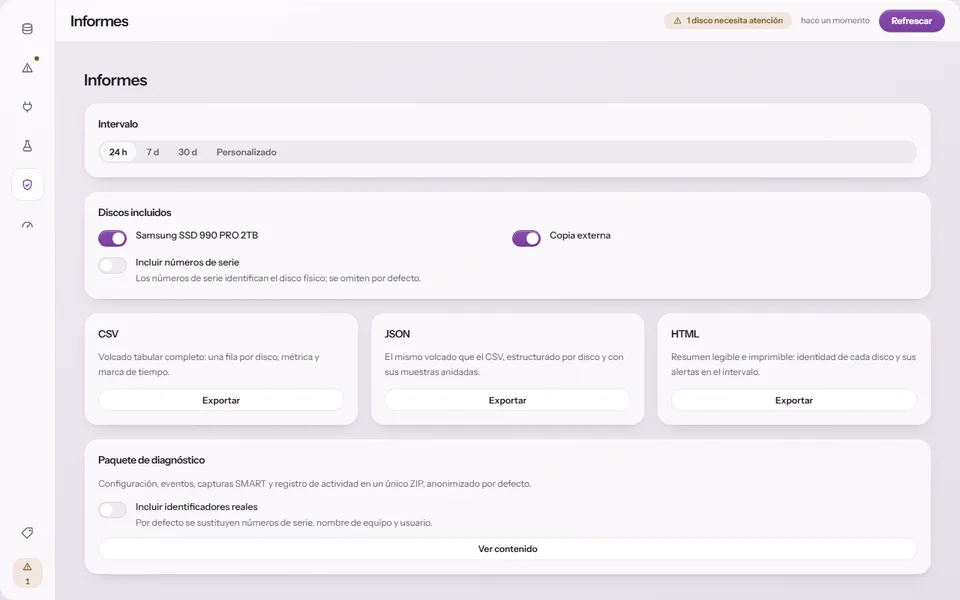
If you need to review the data outside the app, you can export it to CSV, JSON or printable HTML. You can also generate a diagnostic ZIP that gathers useful information to analyse an incident.
That package is anonymised by default: serial numbers, computer name and user are replaced. You can inspect what it contains and decide whether to include real identifiers.
I think this is a more reasonable way to ask for help than sending scattered screenshots and crossing your fingers that you haven't shared too much.
Local by Default. AI, If You Want It
The inventory, metrics and history are stored in SQLite on your machine. Monitoring does not require an account or a central server, and it does not incorporate telemetry.
AI assistance is a separate feature, optional and disabled out of the box. If you enable it, it can explain an alert or a disk's state in plain language. Before sending, there is anonymisation and a preview; that query does involve communicating with an external provider via OpenRouter.
I do not want to hide that difference behind a "everything is local" statement. The local part is the monitoring. The external query occurs only when you decide to use that help.
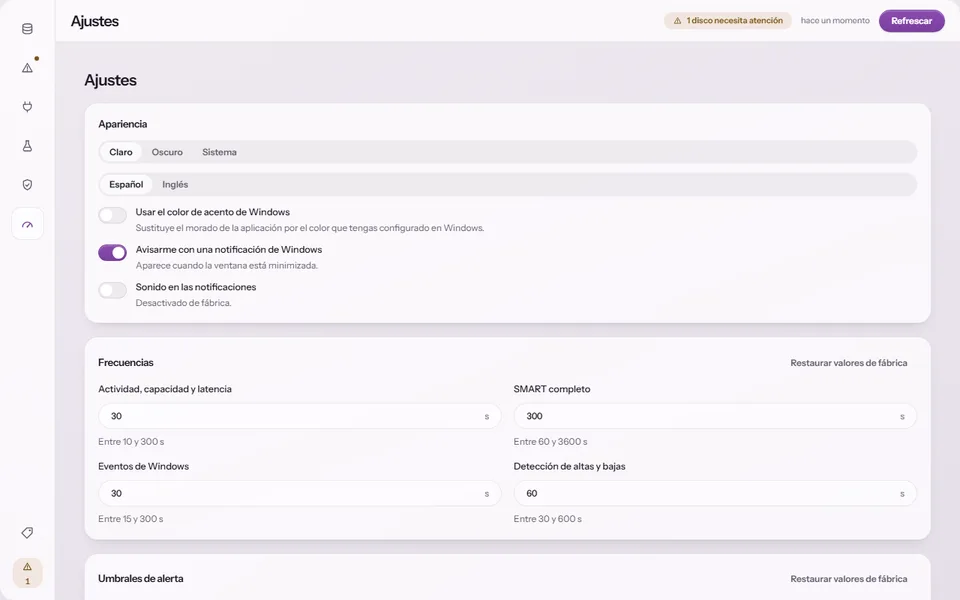
You can adjust collection frequencies, thresholds, history retention, notifications, language and appearance. There is Spanish and English, and light, dark and automatic themes.
What Lies Behind the Screens
I built the application with Tauri and Rust for the desktop and system‑access side, Svelte and TypeScript for the UI, and SQLite to keep the history. SMART reading relies on smartctl and native Windows sources.
The work stems from documented user stories and acceptance criteria. The repository includes logic tests, components, UI and accessibility tests. The screenshots that accompany this sheet use example data from the UI tests.
What interests me is how those pieces fit: distinguishing a missing data point from a failure, preserving the context of an alert, limiting tests and allowing information sharing without exposing identifiers by default. Those are decisions you notice when using an app, even if they don't carry a label.
Available for Windows
You can find it on the SmartDisk Monitor website and view its GitHub code. The code is released under the MIT license.
It works on Windows x64: Windows 10 from version 1809, Windows 11 and Windows Server with Desktop Experience. Administrator privileges are required to read physical devices. The installer is not yet signed, so SmartScreen may show an "unknown publisher" warning.
It monitors while a user session is active and the app is running; it is not a Windows service. And, of course, it does not replace backups nor guarantee detection of every failure.
I want it to help you see the signals that do exist and decide with more information.
The disk holds your data. It makes sense to listen to what it has to say.